Cross-Platform Sales Analytics
Consolidate and analyze sales data from multiple e-commerce platforms for deep business insights
Key Features
Multi-Platform Integration
Automatically combine sales data from Amazon, Noon, and other marketplaces into a single, unified dashboard for complete visibility.
Intelligent Data Visualization
Visualize your sales data through intuitive charts and graphs that highlight trends, patterns, and growth opportunities.
SKU Mapping & Cross-Platform Analysis
Link SKUs across different platforms to analyze product performance regardless of marketplace differences in product listings.
Sales Forecasting & Inventory Optimization
Leverage AI-powered predictive analytics to forecast sales trends and receive inventory management recommendations.
Multi-Currency Conversion
Automatically convert sales figures from multiple currencies into your preferred reporting currency for consistent reporting.
Custom Reporting & Export
Create personalized reports with custom filters and export them in multiple formats for further analysis or sharing with stakeholders.
How It Works
-
Connect Your Accounts or Upload Sales Data
Either connect your Amazon seller account directly or upload sales report files from various platforms. Our system supports multiple file formats including XML and CSV from major e-commerce platforms.
-
Set Date Range and Filters
Select the time period you want to analyze and apply filters for specific marketplaces, stores, countries, or product categories to focus your analysis.
-
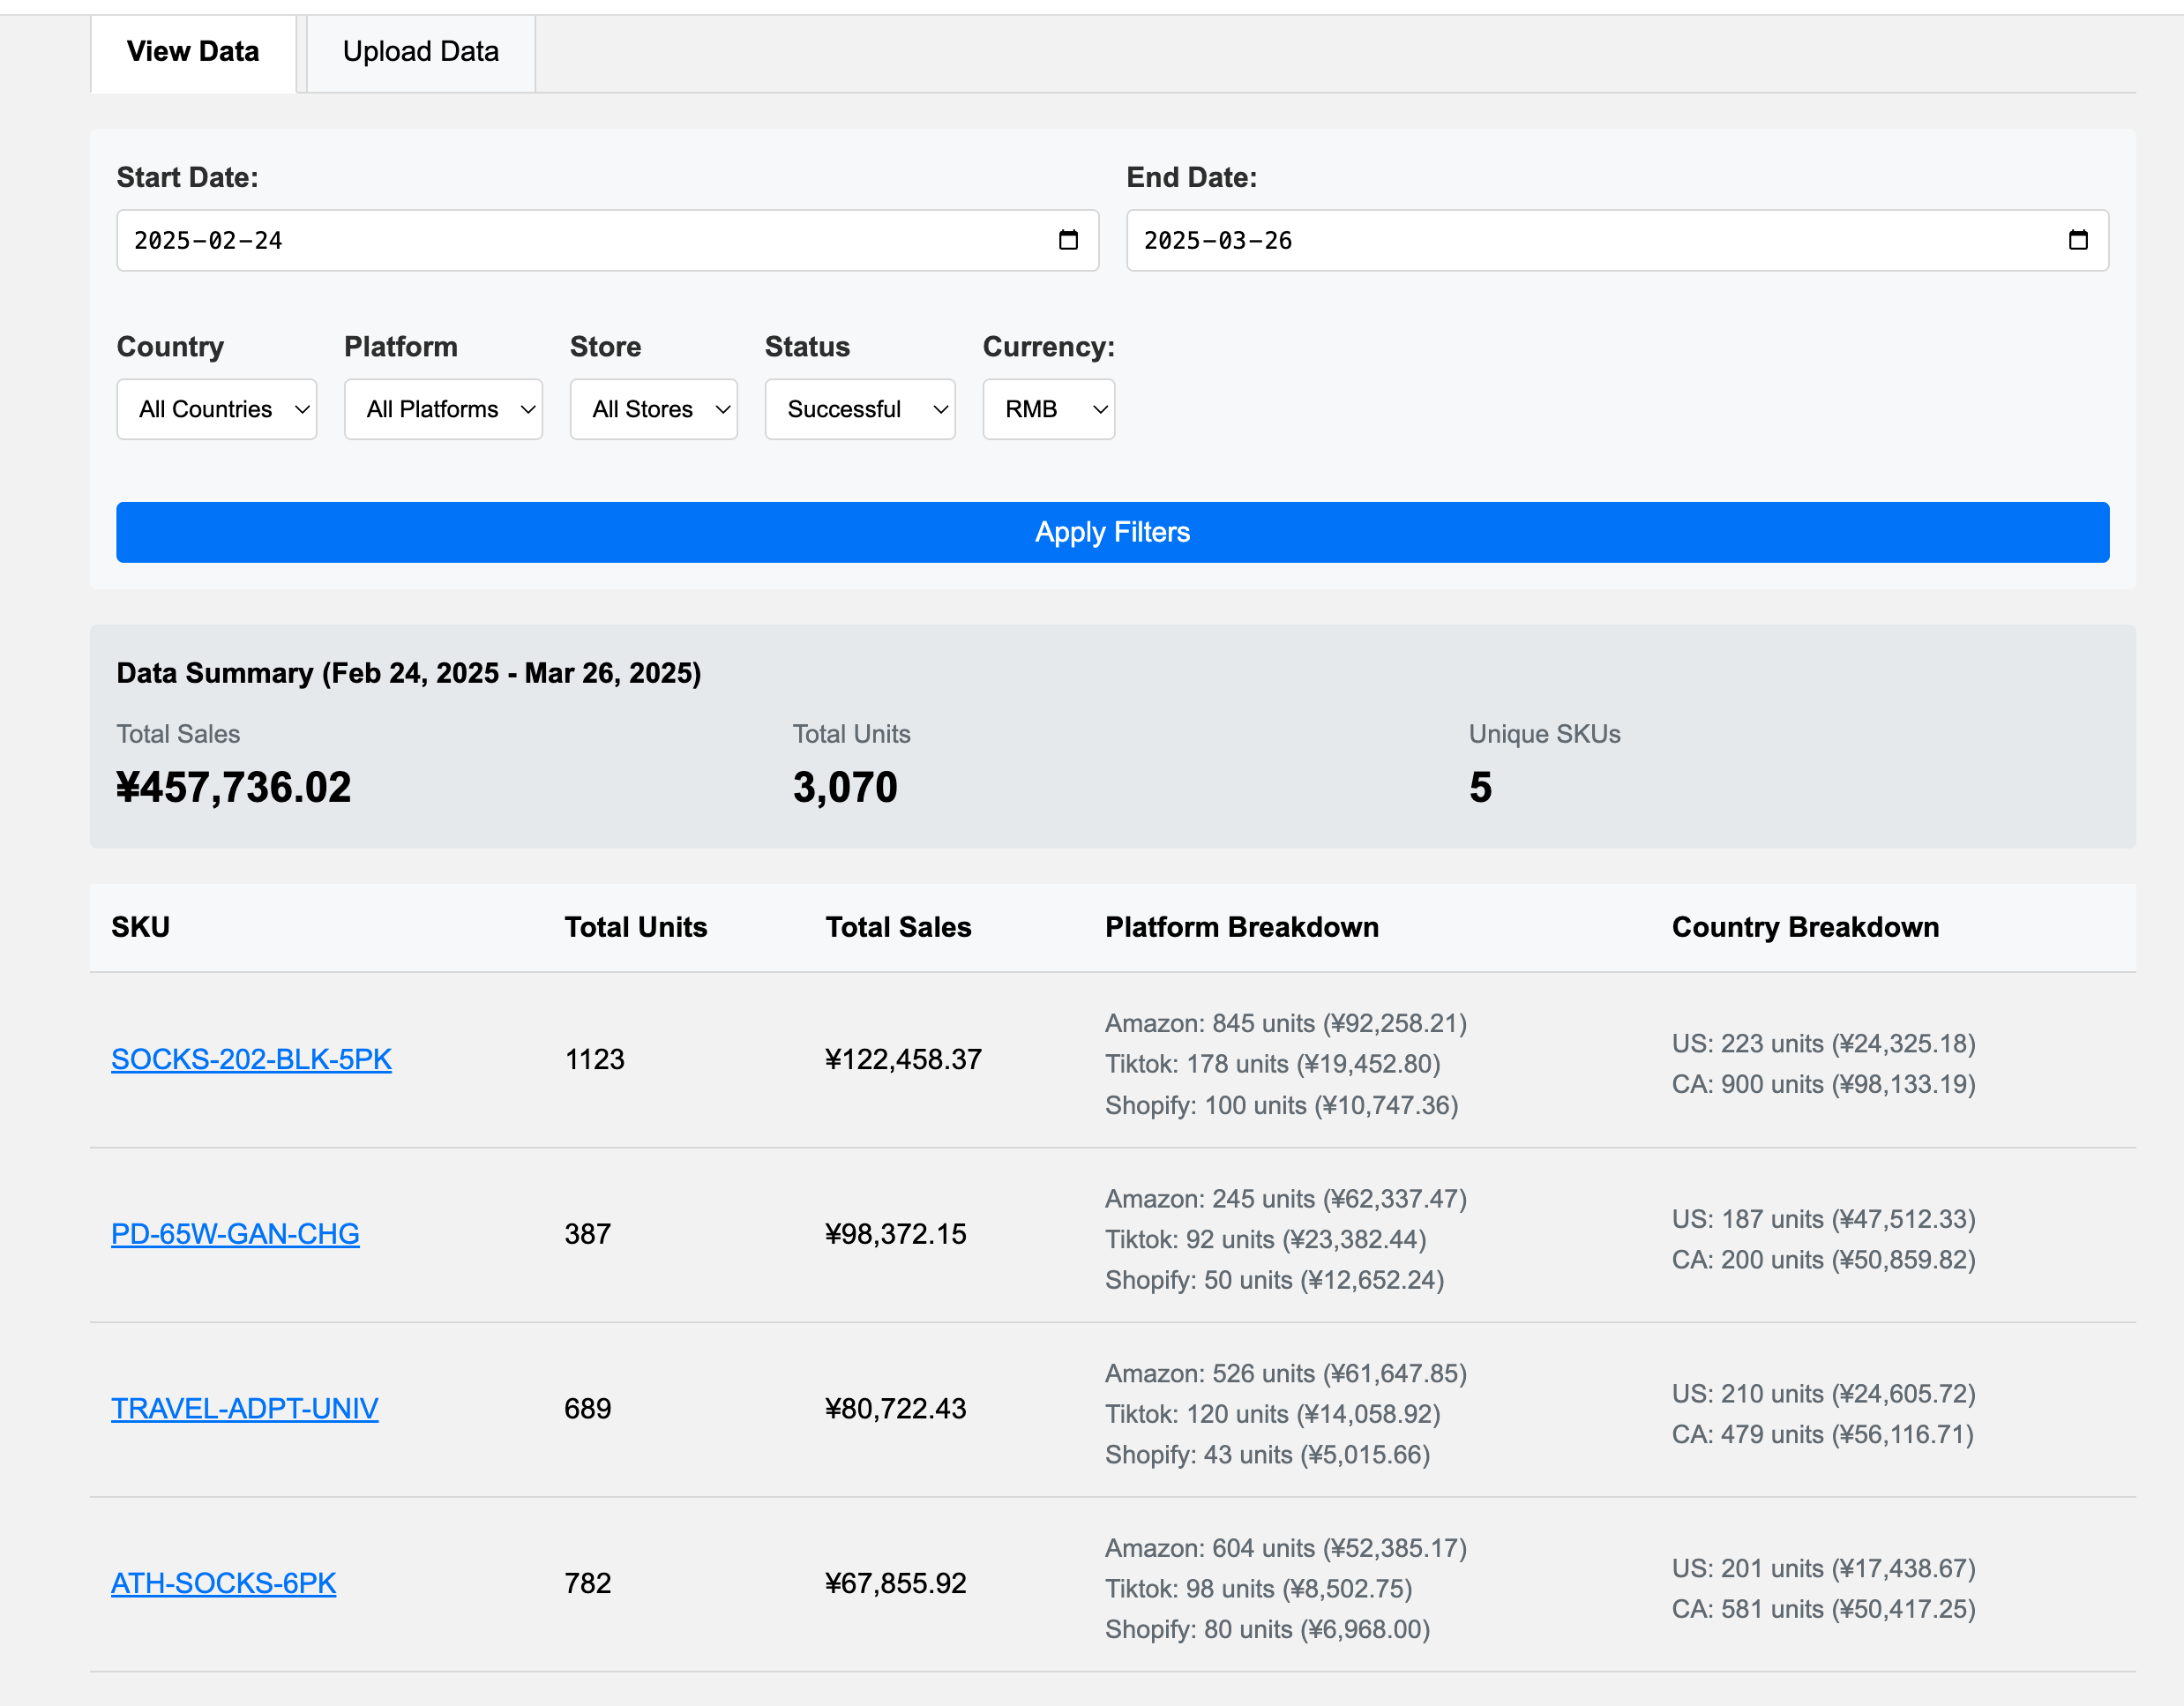
View Sales Statistics and Regional Distribution
Instantly see comprehensive sales data visualized through charts showing total sales, units sold, top-performing products, and geographical distribution.
-
Analyze SKU Performance and Inventory Status
Drill down into individual SKU performance across platforms and review current inventory levels against sales velocity to optimize stocking decisions.
-
Generate and Share Reports
Export customized reports in various formats or set up automated email delivery to key stakeholders on a daily, weekly, or monthly basis.
Dashboard Interface
Success Story
How an E-commerce Operations Manager Unified Multi-Platform Data
Li, an operations manager for a cross-border e-commerce business, was struggling to manually compile sales reports from six different Amazon marketplaces and Noon. The process took three full days each month and often contained errors.
Using ListWizard's Sales Dashboard, Li's team:
- Automatically connected their Amazon accounts to pull real-time data
- Imported historical Noon sales data through CSV uploads
- Mapped product SKUs across different platforms to track true product performance
- Created automated weekly and monthly reports for executives
Results:
The sales dashboard system consolidated data from multiple platforms and sites, helping the team identify hot-selling products and geographical trends. This led to optimized inventory planning and marketing focus, resulting in a 28% increase in sales and a 15% reduction in inventory costs. The monthly reporting process was reduced from three days to just 30 minutes.
Ready to Dive into Your Sales Data?
Access the full dashboard to explore trends, filter by store, and upload new data.
Access Sales Dashboard